Charts
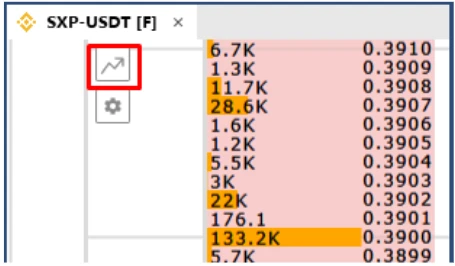
You can open the Chart using this icon on the order book.
Or use the G hotkey.

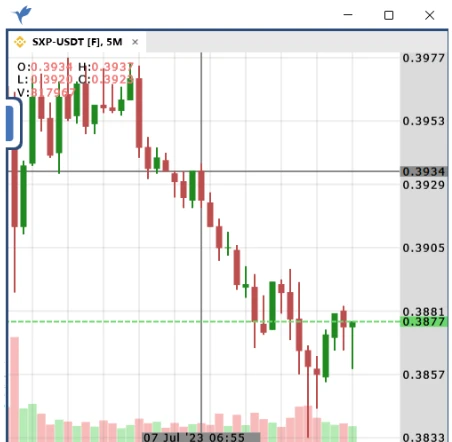
After clicking, the chart of this market will open.

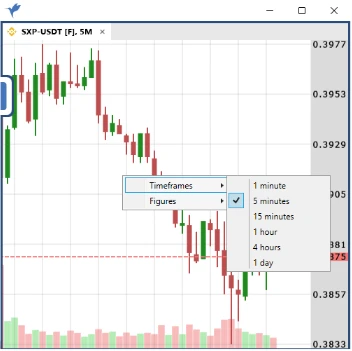
You can change time frames on the chart, and use graphical tools for analysis.
You can open the panel for changing the time frame and tools by right-clicking on the chart.

The graph can be connected to the order book using the docking function, and several graphs can also be connected to each other.

